Ctrl+K
Logo image Logo image
  • Plot types
  • User guide
  • Tutorials
  • Examples
  • Reference
  • Contribute
  • Releases
  • Plot types
  • User guide
  • Tutorials
  • Examples
  • Reference
  • Contribute
  • Releases

Section Navigation

  • Pairwise data
    • plot(x, y)
    • scatter(x, y)
    • bar(x, height)
    • stem(x, y)
    • fill_between(x, y1, y2)
    • stackplot(x, y)
    • stairs(values)
  • Statistical distributions
    • hist(x)
    • boxplot(X)
    • errorbar(x, y, yerr, xerr)
    • violinplot(D)
    • eventplot(D)
    • hist2d(x, y)
    • hexbin(x, y, C)
    • pie(x)
    • ecdf(x)
  • Gridded data:
    • imshow(Z)
    • pcolormesh(X, Y, Z)
    • contour(X, Y, Z)
    • contourf(X, Y, Z)
    • barbs(X, Y, U, V)
    • quiver(X, Y, U, V)
    • streamplot(X, Y, U, V)
  • Irregularly gridded data
    • tricontour(x, y, z)
    • tricontourf(x, y, z)
    • tripcolor(x, y, z)
    • triplot(x, y)
  • 3D and volumetric data
    • scatter(xs, ys, zs)
    • plot_surface(X, Y, Z)
    • plot_trisurf(x, y, z)
    • voxels([x, y, z], filled)
    • plot_wireframe(X, Y, Z)
  • Plot types
  • 3D and volumetric data

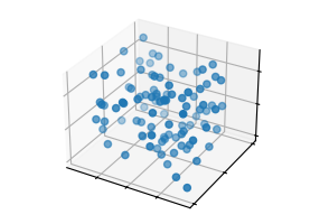
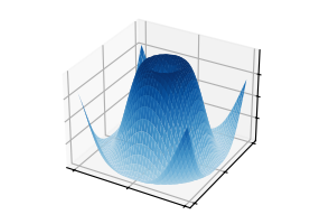
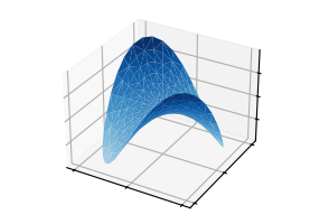
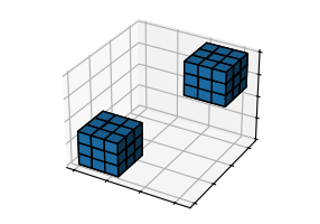
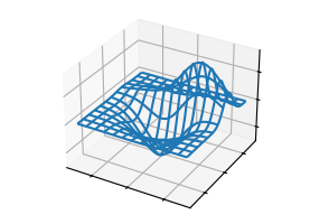
3D and volumetric data#

Plots of three-dimensional (x,y,z), surface f(x,y)=z, and volumetric Vx,y,z data using the mpl_toolkits.mplot3d library.

scatter(xs, ys, zs)

scatter(xs, ys, zs)

plot_surface(X, Y, Z)

plot_surface(X, Y, Z)

plot_trisurf(x, y, z)

plot_trisurf(x, y, z)

voxels([x, y, z], filled)

voxels([x, y, z], filled)

plot_wireframe(X, Y, Z)

plot_wireframe(X, Y, Z)

© Copyright 2002–2012 John Hunter, Darren Dale, Eric Firing, Michael Droettboom and the Matplotlib development team; 2012–2023 The Matplotlib development team.

Created using Sphinx 7.2.6.

Built from v3.8.2-2-gd98fee6e0e.

Built with the PyData Sphinx Theme 0.13.3.